Travis Vander Hoop
- Published on
Interaction to Next Paint
Table of contents:
- What is Interaction to Next Paint?
- Why should you care about INP?
- What does INP measure, exactly?
- How are INP values categorized?
- Okay, but what do the various INP categories feel like?
- What causes poor INP?
- Search Engine Optimization
- Summary
What is Interaction to Next Paint?
Interaction to Next Paint (INP) is a new metric designed to measure the responsiveness of a website’s UI to user interactions. INP will replace its spiritual predecessor, First Input Delay (FID), as a Google Core Web Vital on March 12th, 2024. In contrast with FID, which only measured the responsiveness of the first input event, INP measures a web page’s responsiveness to user interactions across the entire lifetime of a page view.
Why should you care about INP?
- INP is going to factor into your SEO when it becomes a Core Web Vital on March 12th, so you might start seeing less organic traffic if your site is slow to respond to interactions when compared to similar sites. 💸
- Page responsiveness is a core aspect of user experience, and INP can provide UX insights you’ve never had access to before. 💪
What does INP measure, exactly?
For the vast majority of webpage views, the INP value will represent the longest time between a user interaction—a click, tap, or keypress—and the next frame painted by the browser. It captures these timings across the entire page view, and reports the largest value.
Caveat alert
If a given page view has 50+ interactions in a given visit—think of Google Docs or a game where a user issues hundreds of clicks, taps, or keypresses across the lifetime of the page view—the INP value will be the 98th percentile rather than the longest value. This decision was made so as to not penalize sites for true outlier events.
How are INP values categorized?
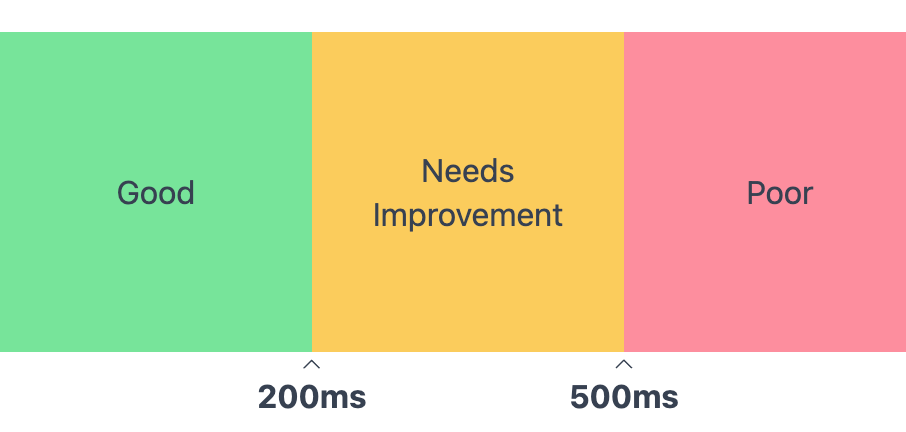
Google considers INP values <= 200ms as good, values > 200ms and <= 500ms as needing improvement, and values > 500ms as poor.

Okay, but what do the various INP categories feel like?
The table below contains demos with artificial delays applied to them to mimic the INP categorizations above. Click around!
| Rating | Delay | Demo |
|---|---|---|
| Good | 50 | |
| Needs Improvement | 400 | |
| Poor | 700 |
What causes poor INP?
TLDR; generally speaking, too much JavaScript.
Modern websites tend to have a tremendous amount of JavaScript running under the hood. This JavaScript can be broken down into 3 buckets:
- application JavaScript required to make the site behave as intended
- vendor JavaScript added for analytics/intelligence/ads/marketing
- vendor JavaScript injected by the user’s chosen set of browser extensions
All of the buckets above have the potential to hijack the main thread (the CPU) in response to a user interaction, thus delaying the next paint. The first bucket’s performance and activity is generally within your control, while the second is only somewhat in your control (depending on where you sit in the organization), and the third is, sadly, entirely out of your control.
Now, there are admittedly other factors that can affect INP, like the amount of render preparation (layout and style calculations) the browser has to crunch through prior to paint, but optimizing INP generally involves taking a katana and a scalpel to the JS you have control over.
I’ll write another post on INP optimization strategies in a (necessarily lengthy 😀) follow-up.
Search Engine Optimization
We wrote above that the INP value for an individual page view is the longest observed value between an interaction and the subsequent paint.
But it’s important to note that for SEO purposes, Google is evaluating sites based on the 75th percentile values reported from visitors all over the world. So while your website might be responsive on your top-of-the-line laptop as you test it from HQ, just know that it may be far less responsive on older or under-resourced devices (or even luxe devices that are low on battery), and those devices are generally what shows up in that 75th percentile.
Well, how do I know if I have a problem with INP?
You should consider using a Real User Monitoring (RUM) platform like rumdash.io to get comprehensive, up-to-the-moment performance analytics, but you can also get a very coarse view of your Core Web Vitals’ health by leveraging the free Chrome User Experience Report (CrUX) dashboard.
Summary
Interaction to Next Paint has already arrived as a useful metric, and will begin factoring into SEO on March 12th. Take this date as a convenient forcing function to critically examine the performance of your site, and take the katana and the scalpel to the code that isn’t serving your users the way it should. Milliseconds make millions. Go forth!